
Graphs & analysis due 1 week after lab date
Final report due 2 weeks after lab date
Overall Objectives
This lab serves multiple purposes. First, it introduces you to the
PCI-1200 data acquisition system. Second, it gives you some initial
experience with C programming. Finally, it will provide an
introduction to thermal systems and how we can model those systems
using tools you already know.
Lab groups for this semester will consist of three people. We will mix
up the lab groups every other lab so that you get the experience of
working with a number of different people.
Grading
In general, each lab will have a combination of required and optional
parts. If your team does only the required aspects of a lab and writes
a clear and concise writeup, your team will receive a B+ on that
lab. If you complete one or more of the optional parts, or extend the
lab in a direction of your own choosing and do it well, then your team
will earn some flavor of A.
The quality of your writeup will be reflected in the grade it
receives. For some labs you will do a formal writeup, and for some the
requirements will be less stringent. For the more informal writeups,
the lab page will give you an idea of what should be in them, but it
is up to you to present the information in an organized, clear, and
concise manner. Before you hand in a lab, read through it yourself and
make sure it conveys clearly the process you followed, the results you
obtained, and any insights you might have gained.
Introduction
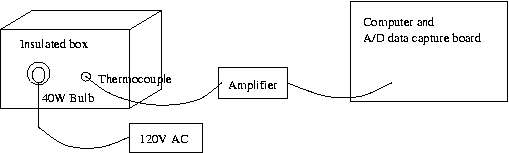
In this experiment, a home-heating system is simulated by a light bulb
(the furnace) heating an enclosed box (the home). The temperature of
the air in the box is monitored by the computer using a thermocouple--
a temperature transducer--connected to a data acquisition system. In a
real home-heating system the temperature of the house determines
whether or not the furnace is on. You, on the other hand, are simply
going to examine the dynamics of this system; that is, how the
temperature of the air in the box varies with time. We will look at
both heating and cooling in the system.
Heat Transfer and Thermodynamics
We will model the system as a simple first-order system with heat
flowing in and out, and energy accumulation evidenced by increased
temperature. The rate of energy accumulation in the box is equal to
the rate of energy flowing into the box minus that flowing out. This
system is analogous to an electrical system.
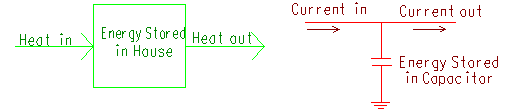
In an electrical system current (Amperes) is analogous to heat flow
(Watts) in a thermal system, so charge (Coulombs) is analogous to
energy (Joules). Voltage (Volts) is analogous to temperature (Kelvins
or °C), electrical resistance (Ohms) to thermal resistance
(Kelvin/Watt), and electrical capacitance (Farads) to thermal
capacitance (Watt-Seconds/Kelvin, also called thermal mass). There is
no thermal analog for inductance.
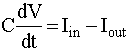
For the electrical system shown, we can write the equation:
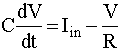
If the output of the circuit is connected to a resistor to ground, we have:

and
For the thermal system, our model leads to the equations:
Rate of Energy Accumulated = Rate of Energy in - Rate of Energy out
Rate of Energy Accumulated = Heat in - Heat out,
or in terms of the systems physical properties.
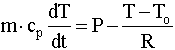
where m, cp an T are the mass, specific heat and
temperature of the air in the box, P is the power (heat) supplied by
the hair dryer, To is ambient temperature, R is the thermal resistance
of the box and t is time. This model is based upon the assumption that
the only energy leakage is due to a thermal resistance, and the energy
accumulation is due to the heating of the air that is inside the
box. If we let Theta = T - To, and C = m ·
cp the equation can be rewritten:
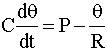
From this equation the analogy between electrical systems becomes
clear. Heat (current) flows into the system. As the temperature
(voltage) increases the heat (current) flow to ambient temperature
(ground) increases proportionately due to resistive losses. It is the
difference between the temperature (voltage) of the house and ambient
(ground) that drives the heat (current) flow. Energy is stored in the
thermal (electrical) capacitance. The greater the temperature
(voltage) differential between the house and the ambient (ground) the
greater the amount of energy stored. We assume that an arbitrarily
large amount of heat (current) can be absorbed by the ambient (ground)
without changing its temperature (voltage). You'll find that this is
not exactly true, the lab is noticeably warmer at the end of the
afternoon than at the beginning-- though not enough to be a very
significant cause of error
From this information it should be possible to find Theta as a function of
time if P is a step input (i.e., it is initially off, and is turned on
a t=0).
Setting Up
Equipment
For this lab we will have one experimental setup for the four groups to share.
-
a simulated house with 40W light bulb,
-
a thermocouple with amplifier
-
a computer with data acquisition equipment
The thermocouple is connected to a thermocouple amplifier whose output
decreases 10 mV for every 1°C rise in temperature. Use a
measurement of the current air temperature in the classroom at the
beginning of the lab to determine a reference temperature (i.e. look
at the thermostate for the room).
Software
If you want to be able to understand the code you will be using to
gather the data, read the C
reference and Data
acquisition reference documents before coming to lab.
As described in the DAQ reference, create a project for your team on
one of the computers in the E12 lab. You might want to create it in
your personal folder on the server so that you can access it from any
of the E12 lab computers.
Once you have created a project, do the following to make sure
everything is working correctly.
-
Connect the power for the thermocouple and ammplifier circuit.
-
Attach a voltmeter to the circuit so that you can see what voltage
the thermocouple is producting.
-
Attach the thermocouple to one of the analong inputs.
-
Compile and run the default program that comes with your
project.
-
Make sure the voltages the computer is reading are close to the
voltages on the voltmeter.
Tasks
-
Connect the output of the thermocouple amplifier to the voltmeter
and connect the power for the thermocouple circuit.
-
Connect the output of the thermocouple to one of the analog inputs
on the DAQ board.
-
Without changing any of the input conditions, collect 100 data
points from the thermocouple. Using this data, calculate the mean
and standard deviation of the measurement system (assuming a
zero-mean Gaussian distribution of measurement noise).
-
Use the data collection program to collect data from an analog input
for as long as it takes for the system to reach equilibrium (plus an
additional 10 seconds for initial data). You will need to determine
a good sampling rate for the task before starting to collect data.
Collect data at a rate faster than really necessary so that you can
average the results to get more accurate estimates.
Note that the program in the NI-DAQ project template is very similar
to the data collection program in the Data Acquisition handout but
includes some additional lines to save the data in a file. Feel free
to modify the program if you want additional functionality (like
converting the data into temperature automatically).
-
Use the program to perform the following experiment (with the lid of the box free to open):
-
Start your data acquisition program running at an appropriate
sampling rate, and set it to run for 3 minutes. 10 seconds after
starting the program, turn on the light bulb. Monitor the box, and
don't let the light bulb get too hot.
-
When the data collection is finished, open the box to let it cool off.
-
Look at your data in a graphing program and see if the system
reached equilibrium. If not, re-run this experiment for a longer
time period, but be sure to monitor the light bulb so that it does
not get too hot.
-
Repeat the previous step with the holes, seams, and cracks covered
as tightly as possible and a weight on the lid to keep it
shut.
-
After the second trial, do not open the box. Instead, we will
collect data from the box to track the cooling down process. Start
up the data acquisition as soon after turning the light off as
possible and let it run for at least 10 minutes. Set an appropriate
sampling rate so that your don't have an overload of data.
Calculations
-
In a spreadsheet, calculate the mean and standard deviation of your
measurements of the constant temperature case.
Also in the spreadsheet, use a moving Gaussian filter to try and
reduce the noise in your signal. Select a time range that is
reasonable for the data (within which the temperature is
appoximately constant). When you fit exponentials to the data,
compare using both the raw data and the filtered data.
-
Calculate the expected R of the system using the fact that the
R-value of the Tuff-R insulation is 7.2 R/inch and the conversion
ratio to get it into SI units is 0.1761 (Cm2 / W) *
(R)-1. Note that, to get the thermal resistance
(C/W), you will need to calculate and use the surface area of the
box.
-
Determine the resistance R of the system for the heating runs from
the final steady state temperature (estimate it with a best fit
exponential if the box does not reach steady state).
-
To calculate thermal capacitance, you will need the density and
specific heat of the air in the box. Values for 50 C are 1.21
kg/m3 and 1 kJ / kg K, respectively. Measure the box to
find its volume, and use this value to calculate its mass. Use the
mass and specific heat to calculate the thermal capacitance C of the
box.
-
Determine C from the time constant of the system from both the
heating and cooling runs. You should find the time constant using a
curve fitting program (like the one in Kaleidograph), don't simply
look for 67% of the final value. See me if you need help with
this.
Extensions
-
For fun, try heating the box with something with a little more
juice. Try putting a hair dryer completely inside the box and
closing up the hole as best you can. Repeat the heating experiment
and compare and contrast your results for R and C. (The hair dryer
will cut off after about 20-30 seconds, so be prepared to grab data
quickly at a high time resolution.)
-
If you block off some portion of the box (like half of it) and redo
the experiment, how does this affect your C value?
-
What happens if you put the thermocouple inside a box inside the
box? Try to use something for which you can estimate the
R-value.
-
Try a more sophisticated method of filtering the data (see the
prof).
Lab Report
The lab writeup for this lab should be in
formal report format. Your writeup should include the following items.
-
Plots of your data using incremental temperature (Theta)
vs. time. Take time = 0 to be the time that the light bulb is turned
on. (You don't need to plot t < 0). For the cooling data, time =
0 should be the first data point.
-
Report all of the values of the thermal resistance that you have
calculated. Is it higher or lower with the box sealed tightly. Is
this what you expected? How does the value of R during cooling
compare with the value during heating?
-
Report your measured and calculated values of C for each data run.
Use a table to show the values side-by-side. How well do the
theoretical and measured values match? How do they compare to the
value of C from the cooling run?
-
Be sure to put all of your theoretical and measurement-derived R and
C values in a single table for easy comparison. Put any other
relevant information in the table as well.
-
If you modified the program at all, include a copy of the program as
an appendix. Your modifications should be well commented, and you
should include a description of them in the writeup.
-
In your discussion, consider any problems with the model we
used. Discuss, and try to explain any discrepancies between the
theoretical and measured values.